解Bug之路-MySQL-Seconds_behind_master精度问题引发的思考
核心反常点:不同从库看起来长期相差约 500ms 延迟,但网络并没有对应差异,真正的问题是 Seconds_behind_master 的秒级精度无法刻画毫秒级主从延迟。
解Bug之路-MySQL-Seconds_behind_master精度问题引发的思考
前言
监控指标是我们日常分析排查问题的利器。但指标所能表示的精度也是有限的,用这些指标去衡量超出其表示范围的数据往往就会造成一些"误判"。而用Seconds_behind_master去评估1s内的主从延迟就是一个经典的例子。
问题现场
笔者最近发现了一个很奇怪的现象。不同的从库表现出来的主从延迟(Seconds_behind_master)差距有将近500ms之巨!如下图所示:
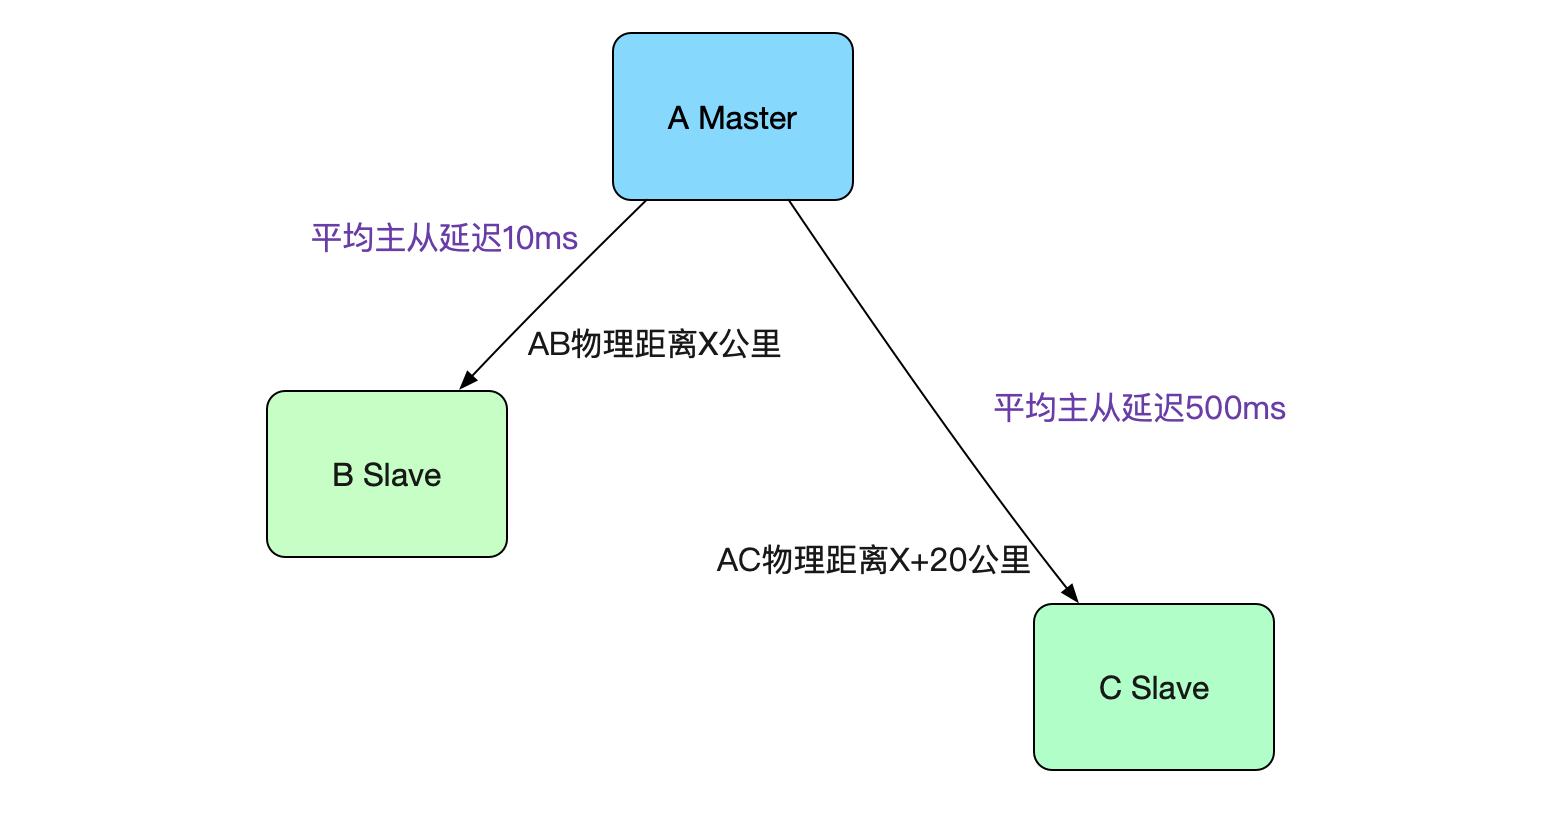
有点诡异,在相同配置机器的情况下,20公里能造成将近500ms的主从延迟差距么?
网络问题?
最先想到的那必须是网络问题,ping了一下。发现最多也就相差1ms,这个和500ms的差距过大,看来还有其它因素的影响。
Seconds_behind_master的取点数据
翻了下MySQL的指标,发现Seconds_behind_master是以秒(s)为单位的。那么我们的监控中是如何算出来毫秒的呢?带着这样的问题,我挖掘了一下监控指标取点的真实数据。如下所示:
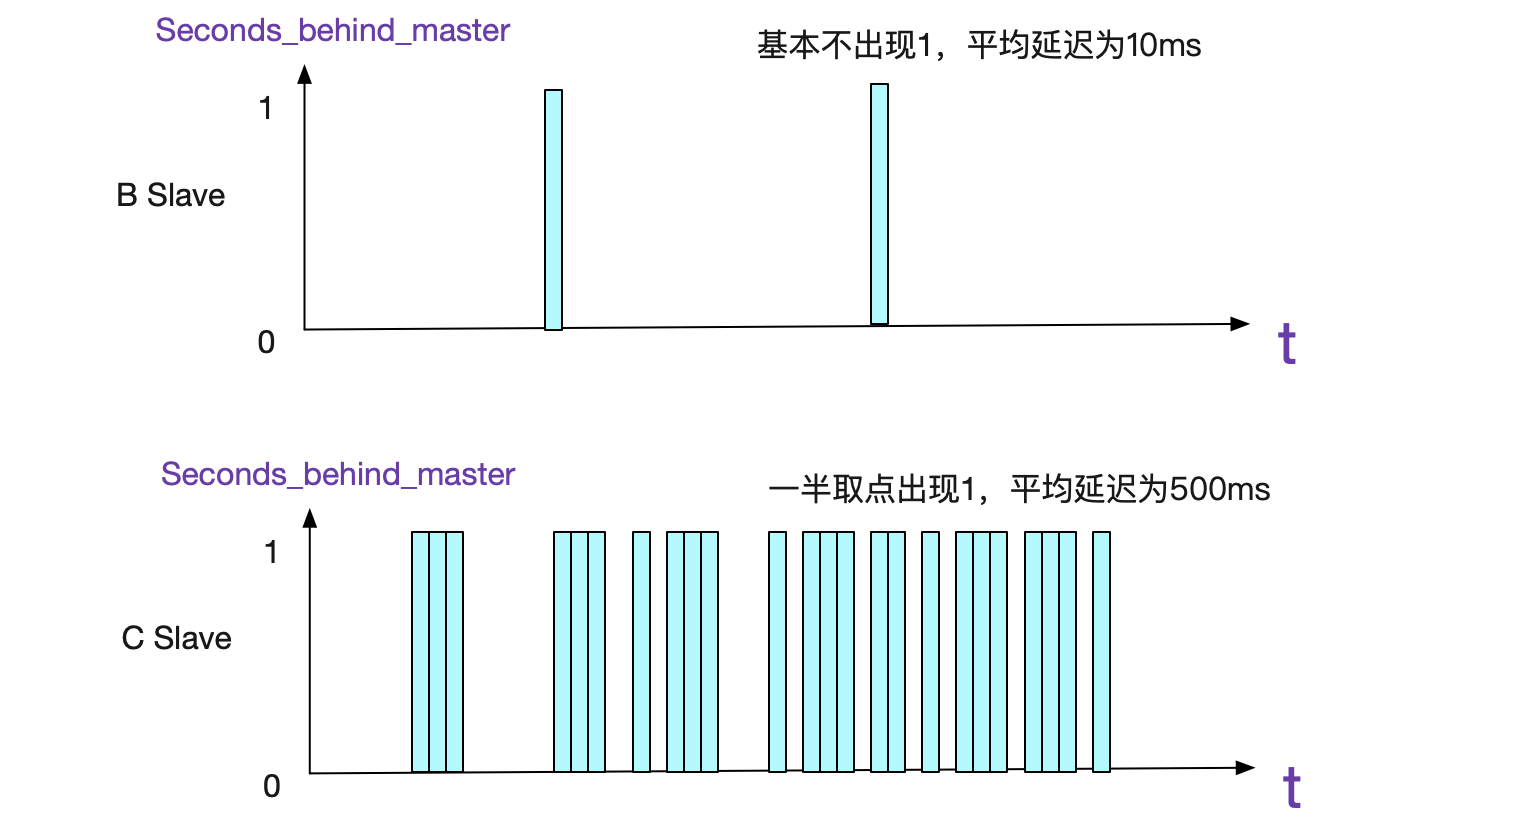
看来主从延迟真的很大?C Slave从监控取点来看确实有主从延迟。
什么时候计算出来为1,什么时候计算出来为0
这时笔者突然想到一个问题,Seconds_behind_master什么时候计算出来为1、什么时候计算出来为0的呢?会不会按照四舍五入法,<500ms的就是0,>=500ms的就是1呢?这样是不是就能解释两个从库的指标取点不同呢,一个卡在499ms、一个卡在501ms?为了了解这一问题,笔者探究起了源码。
Seconds_behind_master的计算源码
事实上,这个指标的计算在MySQL源码中有很多其它微妙的分支。在此笔者只列出当前笔者遇到问题下相关的源码。
long time_diff= ((long)(time(0) - mi->rli->last_master_timestamp)
                       - mi->clock_diff_with_master);
关键点在于这个clock_diff_with_master。这边需要先引入一个容易被忽略的常识,那就是不同机器的时间戳是不一致的!所以我们在计算Seconds_behind_master的时候需要去掉时间戳不一致的影响,而这个就是clock_diff_with_master!
clock_diff_with_master的计算时机
首先我们看一下计算clock_diff_with_master的时机
handle_slave_io
	/* 建立主从连接 */
	|->safe_connect(thd, mysql, mi))
	/* connected: 连接成功后,计算一下主从clock\=_diff_with_master */
	|->get_master_version_and_clock
上面代码栈表明是在主从连上或者重连(reconnect)的那一刻去计算一次clock_diff_with_master,以后直到下一次重连之前就一直用这个值了。
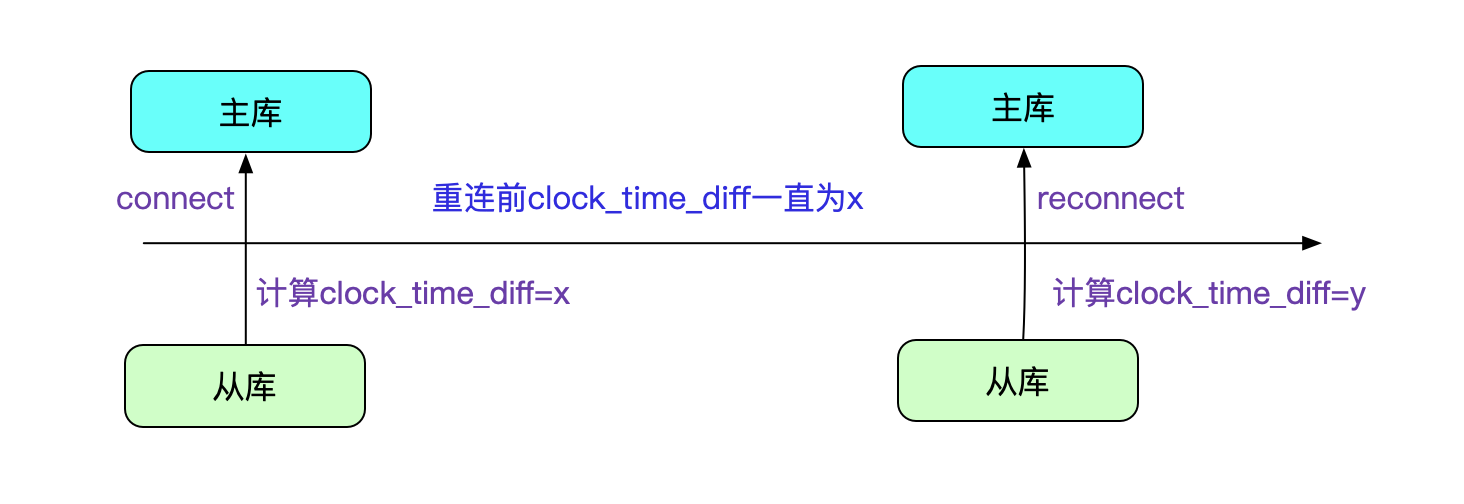
clock_diff_with_master的跨秒问题
在这里,笔者察觉到这个clock_diff_with_master的计算,精度是只能到秒的。那么自然就会有下面的几种现象,为了简单起见我们假设绝对时钟是从0开始。
实际主从延迟为0,clock_diff_with_master计算出来为-1,Seconds_behind_master计算为1
因为精度只能精确到秒。那么假设在计算clock_diff_with_master的那一瞬间。从库的clock是0.5s,主库的clock是1.0s,那么他们的时间差就会由于精度的原因从0.5s放大到1s。
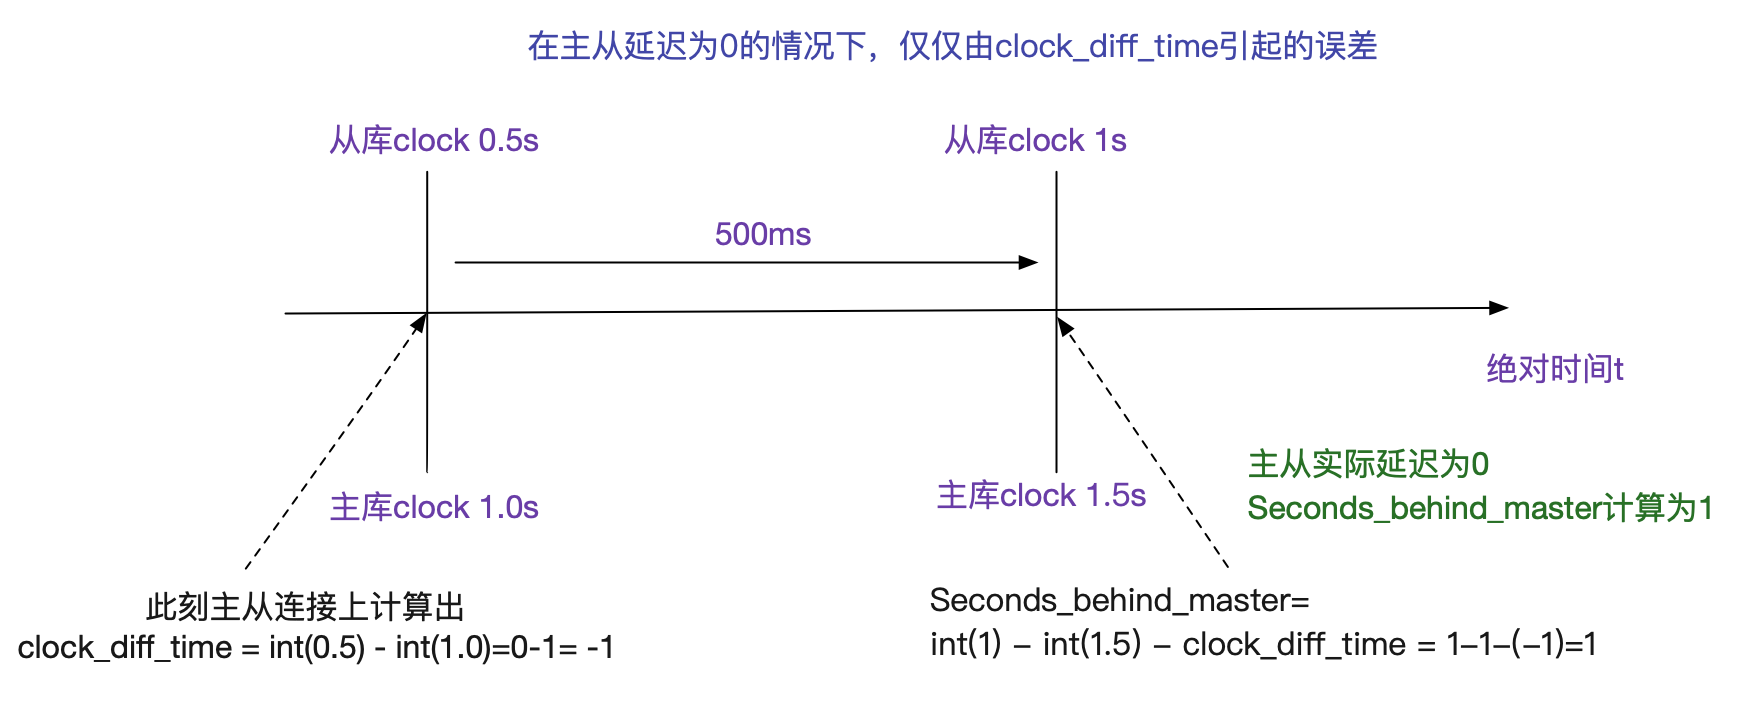
此时的clock_diff_time计算为-1.假设我们在500ms之后计算Seconds_behind_master。那么如上图所示,虽然实际主从延迟为0,但是Seconds_behind_master计算出来为1。
此种情况的监控取出的Seconds_behind_master平均值
以上面的case为例,我们看一下对指标Seconds_behind_master平均值的影响。假设我们的监控取点是随机的,也就是可能落到1s内的任意一个点上,我们进行一下平均值的计算。
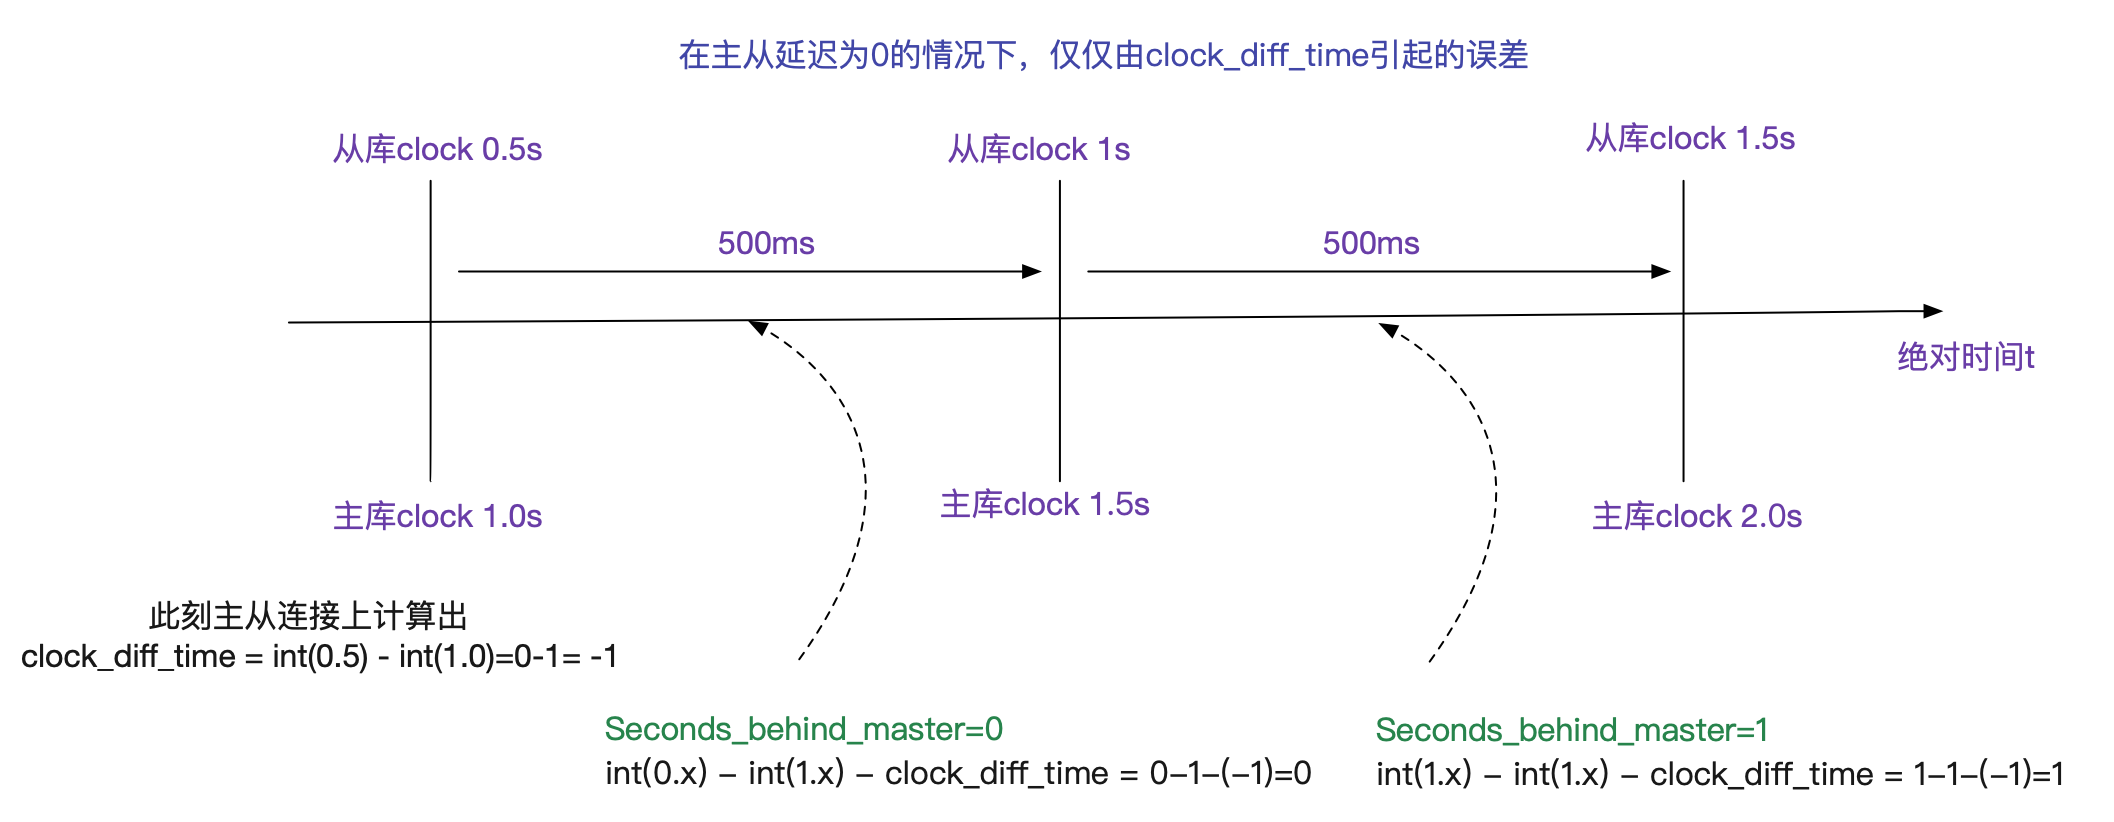
在上面的案例中,在从库[0.5,1.5)的这一秒内。在[0.5,1)区间计算出来Seconds_behind_master为0,在[1,1.5)区间计算出来Seconds_behind_master为1,那么平均值就为(0.54_50.5*1)/(0.5+0.5)=0.5=500ms!!!!!!
实际主从延迟为0,clock_diff_with_master计算为0,Seconds_behind_master计算为-1并被校正为0
在这里我们依旧以主从之间的时间差有0.5s计算,但是这里面我们稍稍偏移一下,使得计算的clock_diff_with_master时候不跨秒,如下图所示:
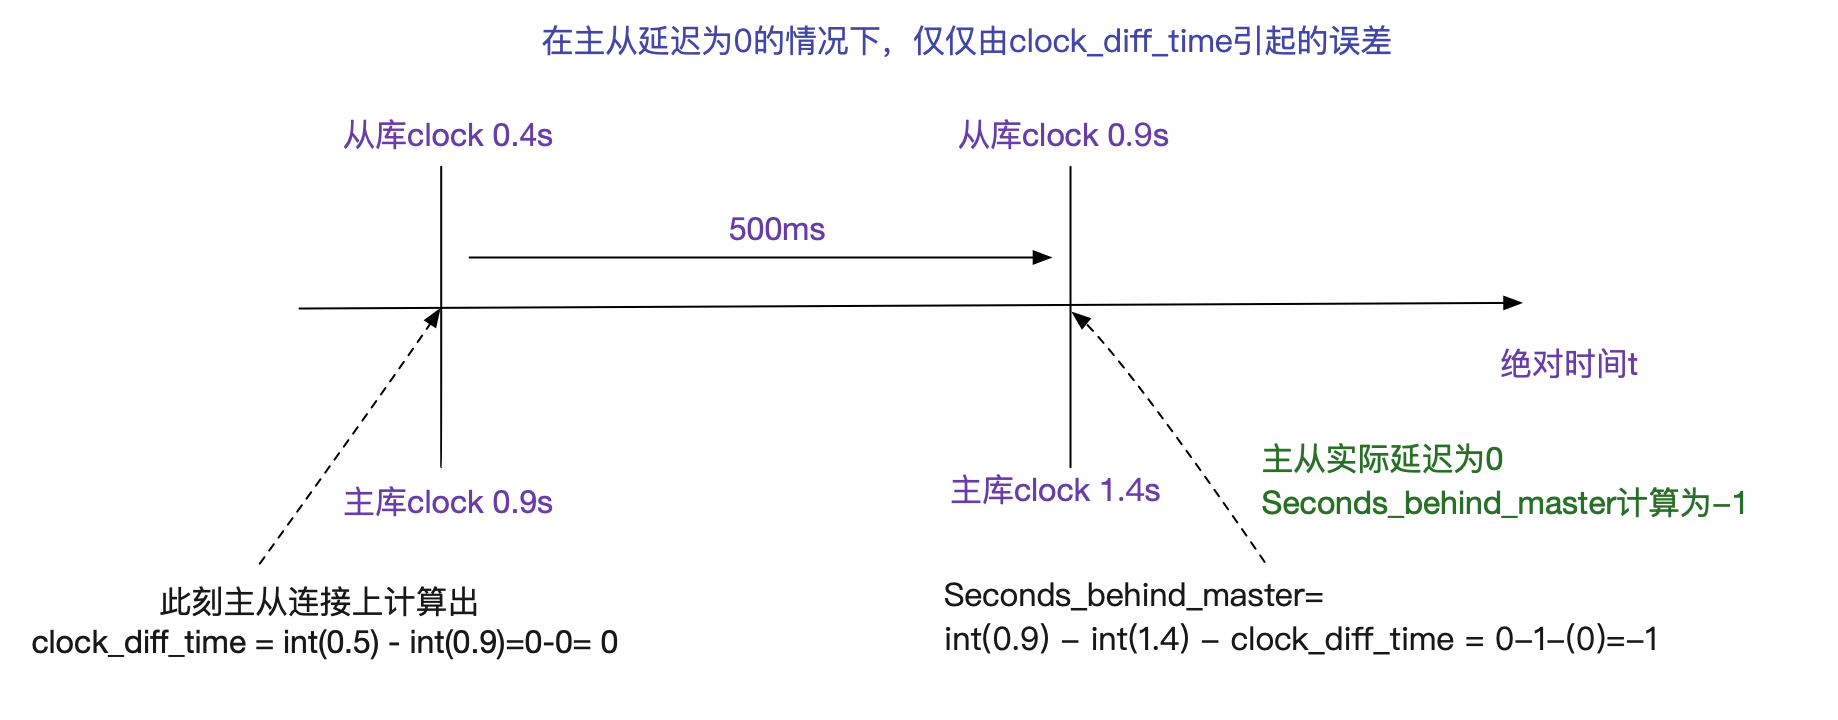
按照上面的计算,Seconds_behind_master由于精度问题会出现-1这样一个非常令人迷惑的结果,它会让人觉得从库竟然比主库还快!所以MySQL源码中针对这一问题作出了详细的解释。并在计算为-1之后,强行校正为0!源码如下所示:
      long time_diff= ((long)(time(0) - mi->rli->last_master_timestamp)
                       - mi->clock_diff_with_master);
      /*
        Apparently on some systems time_diff can be <0. Here are possible
        reasons related to MySQL:
        - the master is itself a slave of another master whose time is ahead.
        - somebody used an explicit SET TIMESTAMP on the master.
        Possible reason related to granularity-to-second of time functions
        (nothing to do with MySQL), which can explain a value of -1:
        assume the master's and slave's time are perfectly synchronized, and
        that at slave's connection time, when the master's timestamp is read,
        it is at the very end of second 1, and (a very short time later) when
        the slave's timestamp is read it is at the very beginning of second
        2. Then the recorded value for master is 1 and the recorded value for
        slave is 2. At SHOW SLAVE STATUS time, assume that the difference
        between timestamp of slave and rli->last_master_timestamp is 0
        (i.e. they are in the same second), then we get 0-(2-1)=-1 as a result.
        This confuses users, so we don't go below 0: hence the max().

        last_master_timestamp == 0 (an "impossible" timestamp 1970) is a
        special marker to say "consider we have caught up".
      */
      protocol->store((longlong)(mi->rli->last_master_timestamp ?
                                   max(0L, time_diff) : 0));
如何获得毫秒级的主从延迟
由于Seconds_behind_master精度的原因无法准确的反映毫秒级的主从延迟情况(甚至会有非常大的误差),所以出现了pt-heartbeat这样的工具去精确的计算主从间毫秒级的延迟。在后续DBA采用pt-heartbeat进行监控后,也验证了笔者的想法。看上去主从延迟(Seconds_behind_master)相差非常大的两个从库之间的精确主从延迟的差距实际<1ms。
总结
虽然监控指标是我们分析问题的利器,但它的计算方法以及精度也是有着相应的适用范围。在日常分析问题过程中如果遇到了有悖直觉的监控指标时候,可以尝试去弄清楚指标的计算方法,这样才不至于思维走向弯路。
公众号
关注笔者公众号,获取更多干货文章: